How Does the Visual Language of Architecture Diagram Enhance Architectural Communication?
[ad_1]
What is an Architecture Diagram?
Effective communication is critical in architecture, where dynamic and complex dances occur between ideas, concepts, and visions. Architects use a wide range of tools to express their creative ideas, and diagrams stand out as powerful visual tools that transcend the limitations of language. Diagrams have become intricate representations, essential in architectural design, over thousands of years.
Diagrams are visual representations of ideas presented in a two-dimensional style (but they can portray three-dimensional things). The phrase “diagram,” which includes text, forms, and lines, comes from the Greek words for “marked out by lines.” These visual tools have a long history, dating back thousands of years, and have grown in sophistication.
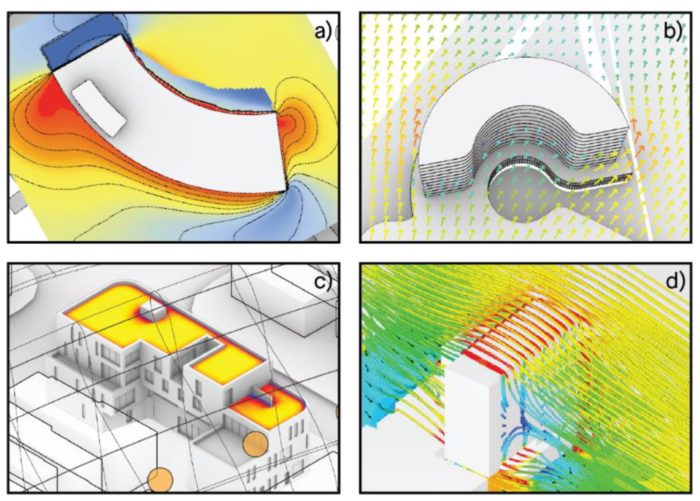
Architectural diagrams represent the project’s synthesis: they communicate the programs and strategies specified by numerous aspects. They are a visual language and an excellent tool for generating and communicating design concepts when you begin a project. They are not exact or scaled to be technical drawings or models, although they can be in two or three dimensions. These diagrams are conceptual or schematic since they depict relationships between design elements and concepts in bare abstract pictures.
What Is the Difference Between a Diagram and a Drawing?
In architectural design, we overuse the words ‘diagram’ and ‘drawing.’ But are they the same thing?
Diagrams are technical drawings as well because we ‘draw’ them. They are not, however, building designs with specific measurements or materials. We visualize the concept using architectural diagrams. We provide building plans based on 3D models only once the design has been finalized.
Also read: Why do Architectural Sketches Still Matter in the 21st Century?
What are architecture diagrams used for?
Architectural diagrams serve many tasks depending on when and how they are used. They are frequently used in the early phases of the design process to aid thinking and assist architects in issue-solving.
1. A Pictorial Essence of Design
A picture is supposed to be worth a thousand words. Diagrams are those pictures in the world of architecture. They reduce complex information to simple, readable visual representations. Diagrams, whether depicting the flow of human traffic, the relationship between spaces, or the structural logic of a building, distill design to its essence, making it easily accessible.
2. Linking The Gap
Diagrams serve as a bridge between the abstract world of notions and the concrete world of created forms. An architectural project may begin as a hazy concept or a strong feeling. Converting this into a tangible structure necessitates a series of judgments and improvements. Diagrams document this journey, providing insights into the architect’s thought process and assisting stakeholders in understanding the underlying concepts driving the design.
3. Eliciting Emotion and Mood
Diagrams have the power to elicit emotions in addition to their intellectual utility. Architects can develop diagrams that illustrate function and logic and communicate the ambiance and mood of planned places by experimenting with colors, shapes, and compositions. This emotional resonance allows for a more intimate connection with the audience, encouraging empathy and enthusiasm for the project.
4. Facilitating Collaboration
The collaborative character of architectural projects necessitates open communication between all stakeholders, from clients and consultants to contractors and end users. Diagrams bring these disparate participants together. They serve as instruments for brainstorming, discussion, and decision-making, ensuring everyone is on the same page with the project’s goals.
5. Enhancing Public Engagement
Diagrams are critical in garnering support and input for projects that include community or public stakeholders. Architects can include the community in the design process by providing ideas transparently and engagingly. This not only builds trust but also frequently leads to more contextually relevant and accepted designs.
6. An Analysis and Reflection Tool
Diagrams are helpful for more than just future planning. They can also be used to study existing buildings or urban landscapes in the past. Architects get insights into prospective areas of intervention or improvement by diagramming the flows, patterns, and linkages in a current setting.
Types of Architectural Diagrams.
1- Planimetric:
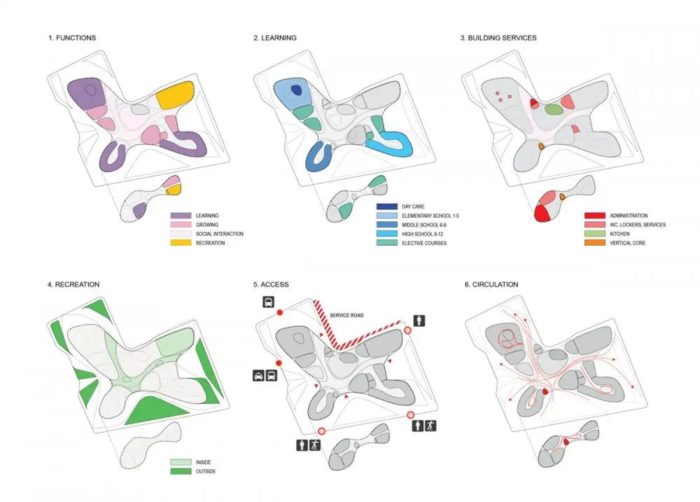
Planimetric diagrams, as the name implies, depict plans, i.e., views or elements of buildings as seen from above. They differ from genuine plans because they are representational, with no accurate scales or proportions.
2- Sectional:
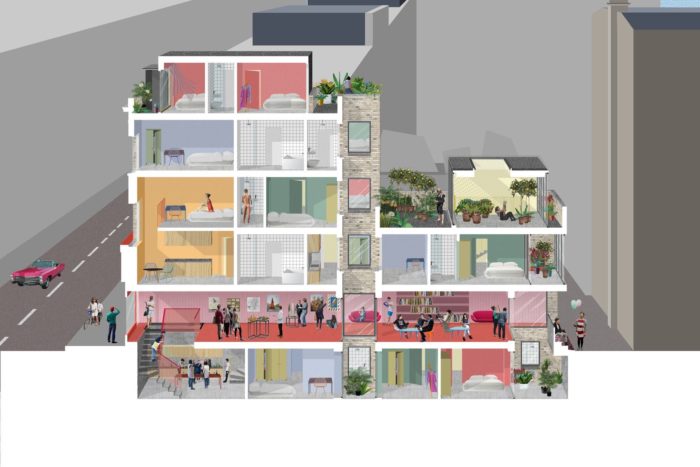
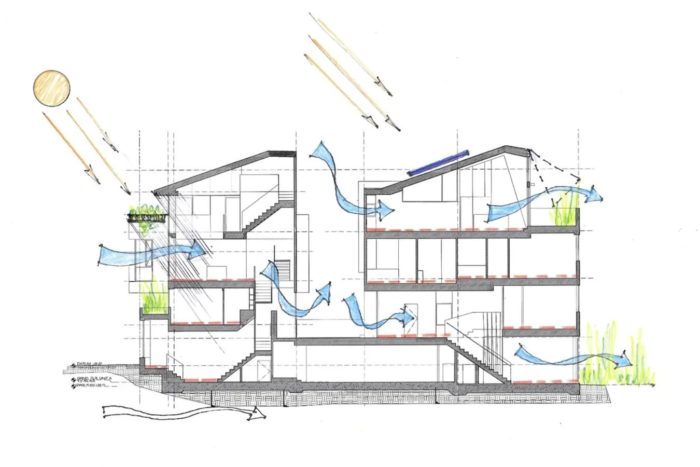
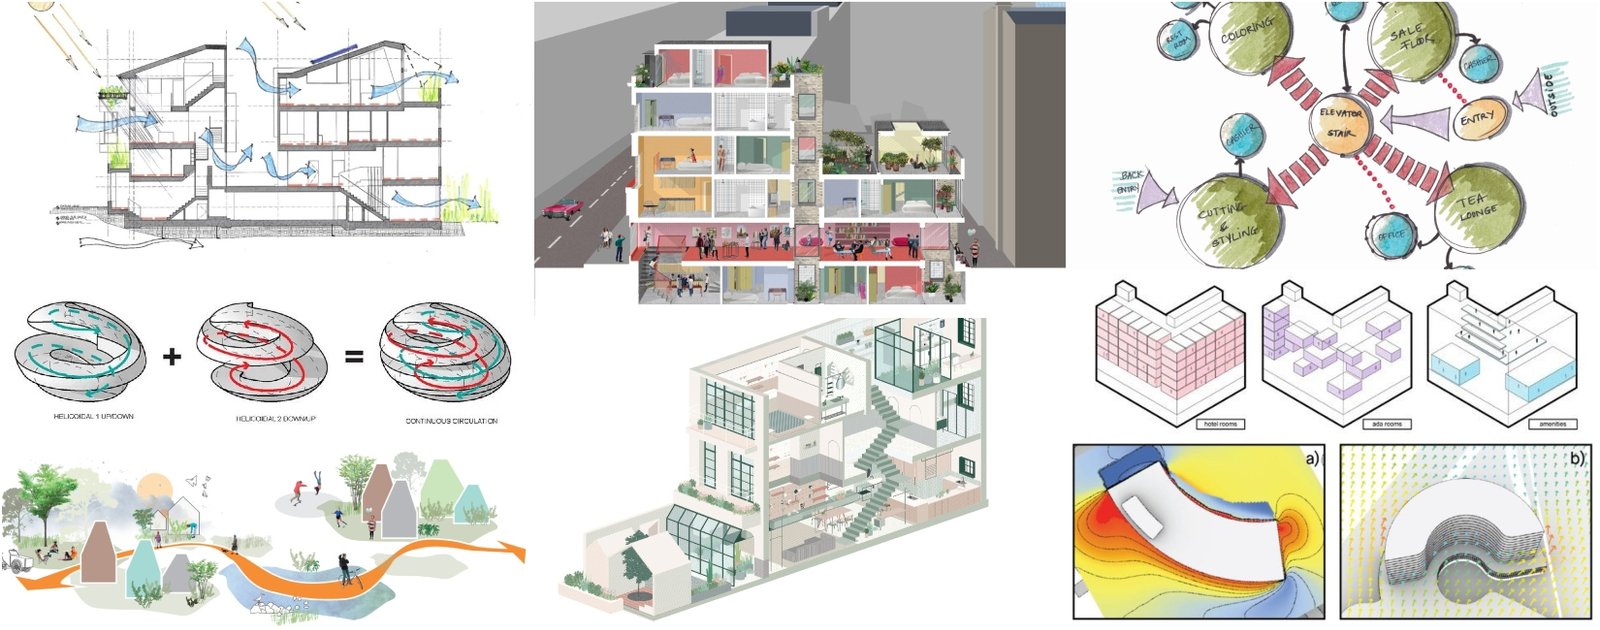
The vertical sectional cut through the building is depicted in these diagrams to demonstrate the conceptual idea. A sectional architecture diagram typically includes program, vertical circulation, ventilation, landscape, and daylighting signals. The diagram, while not to the scale of the actual building, ties every facet of the design to the human scale. As a result, it cannot be used as a construction instruction.
3- Axonometric:
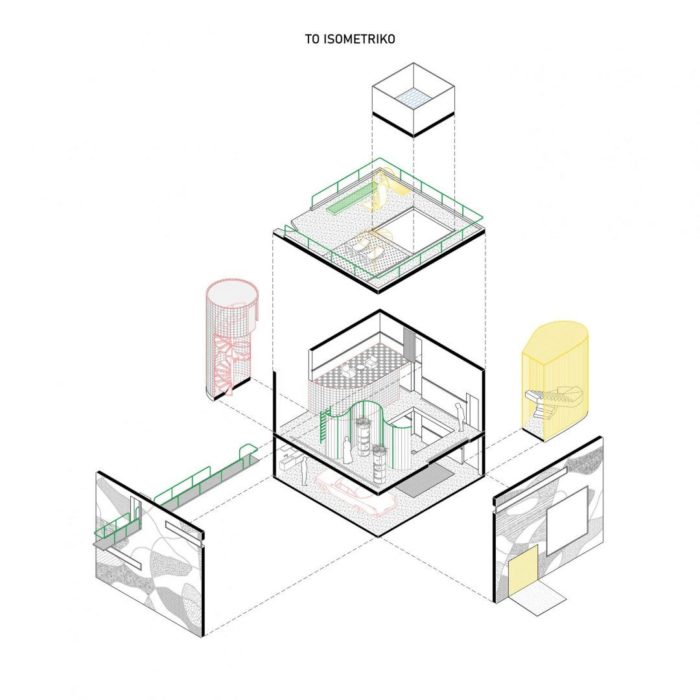
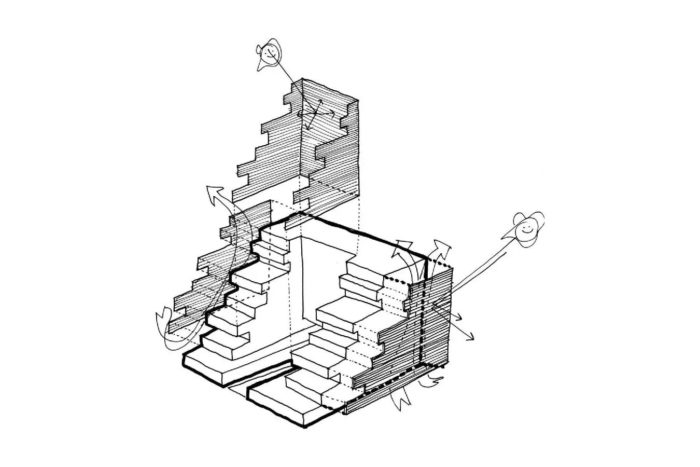
We can use axonometric architecture designs with the concepts and elements viewed from the outside to mix the horizontal and vertical aspects. Axonometric diagrams can depict the entire structure or a 3D representation of each floor and element. Both are common diagrams in architectural presentation boards since they may display all of the
4- Programmatic:
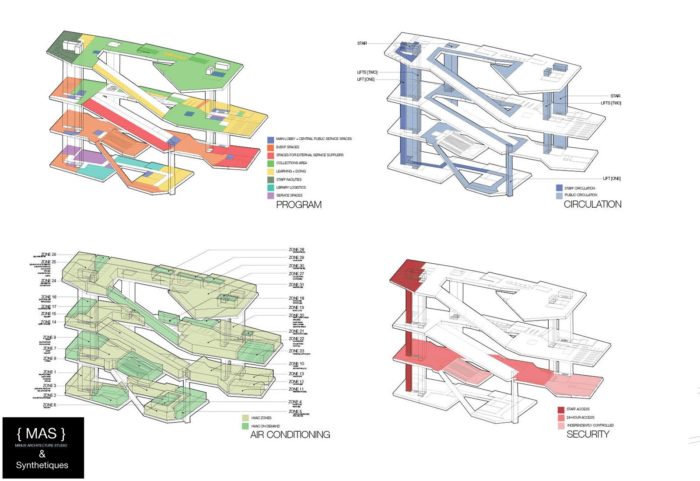
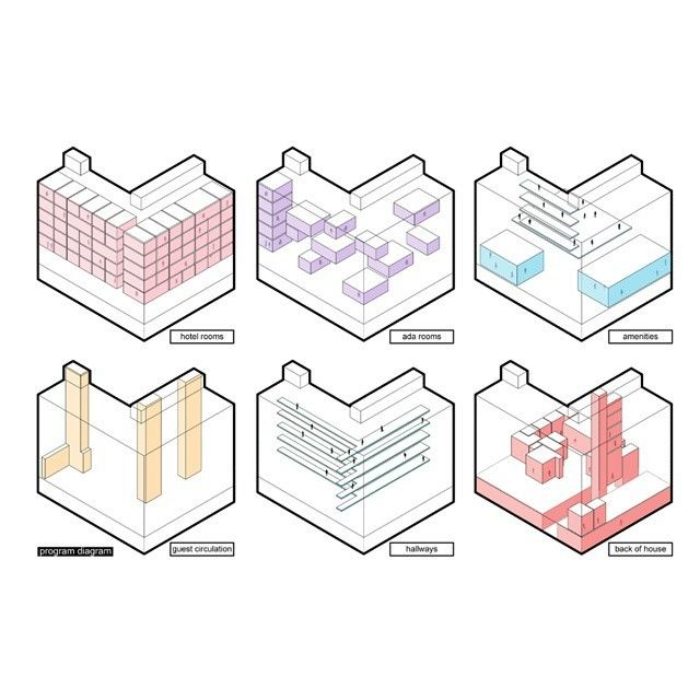
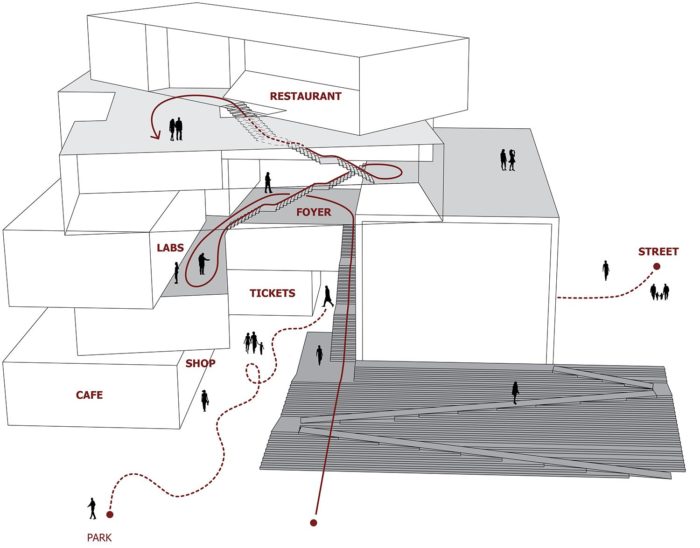
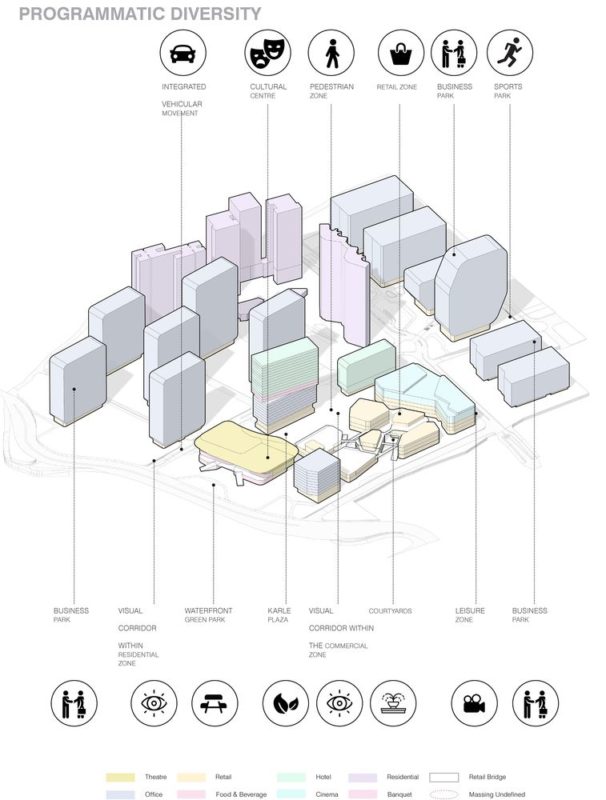
A programmatic diagram depicts the arrangement of a structure and how people will use it. The diagrams below for Book House and the Seattle Central Library show the building’s design and section circulation visually and appealingly.
5- Context:
Contextual diagrams can appear abstract because they depict how a building links to a larger landscape. These diagrams, which represent abstract notions of a generic concept, are sometimes less detailed than others, yet they are crucial in expressing a project’s immediate and global surroundings.
6- Circulation:
Circulation diagrams are critical for understanding traffic flow and movement in and out of the structure. These maps often focus on activity within the building, but we may also generate diagrams depicting automobile and pedestrian flow around the site. Circulation diagrams and spatial programs can determine users’ movement and public and private places. Indeed, public and private locations can impact circulation; unwanted traffic should be avoided in personal settings.
7- Structural:
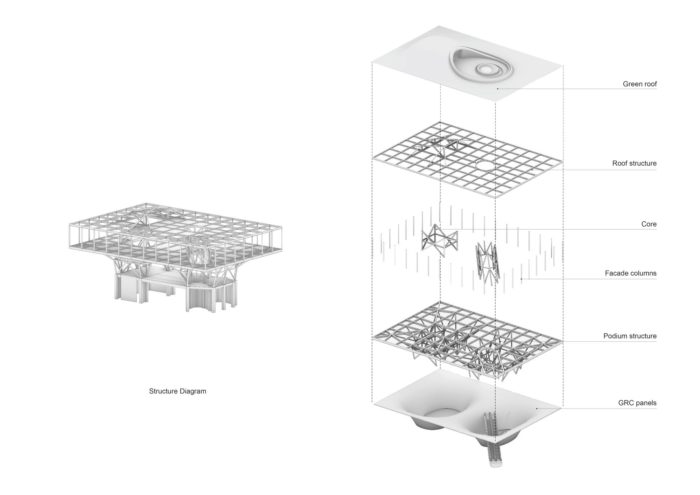
Structural diagrams are typically used later in the conceptual design phase when the building structure becomes an important component. The structural elements, like the programmatic diagrams, are shown in planimetric, sectional, or axonometric views. The axonometric, which can be exploded to display each part of the structure, is the most excellent option. Once again, these structural features only depict the concept, not the actual building plans.
8- Bubble diagrams:
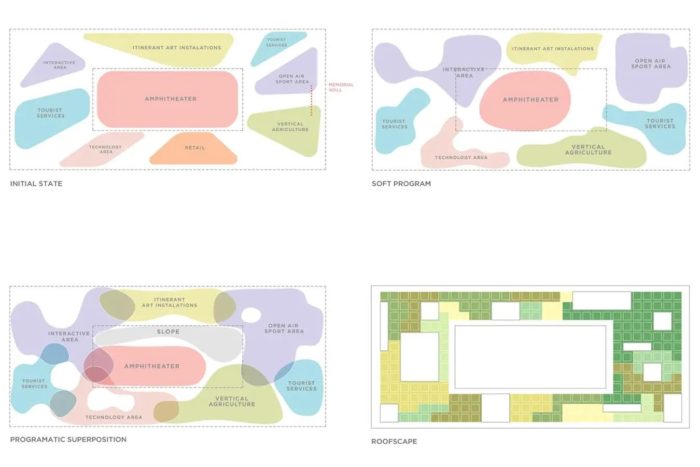
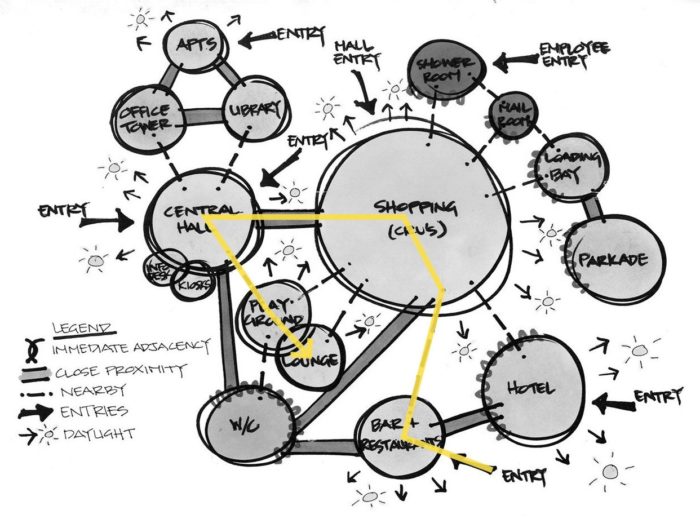
Of course, we can always remember bubble diagrams! Bubble diagrams are programmatic diagrams that represent the spaces, their functions, relative dimensions, and scale. Using bubble diagrams, we can determine the relationship between each space in a design project.
Architectural scale diagram
The objective of scaled diagrams is to provide context and aid in the relationship of one building to another. This can be accomplished by using the scale of everyday human activities and any other well-known reference.
9- Sequential:
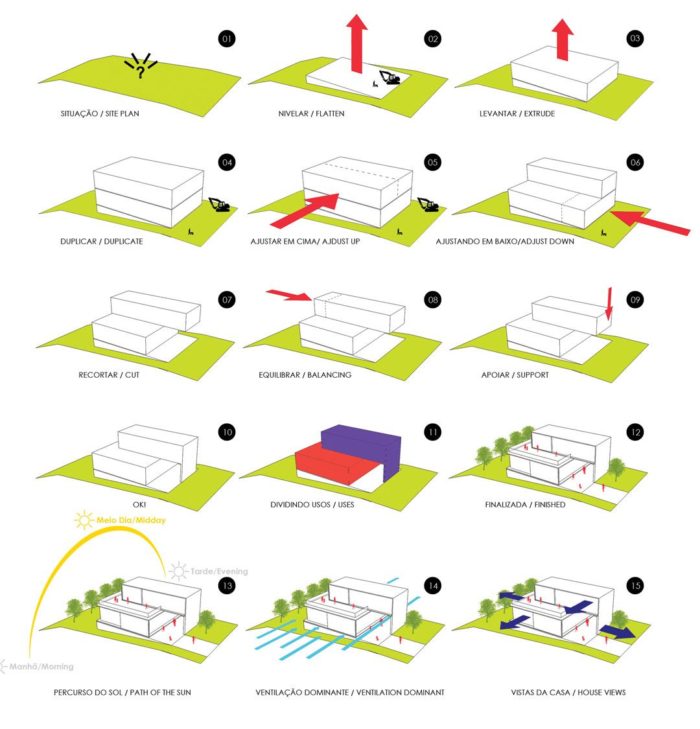
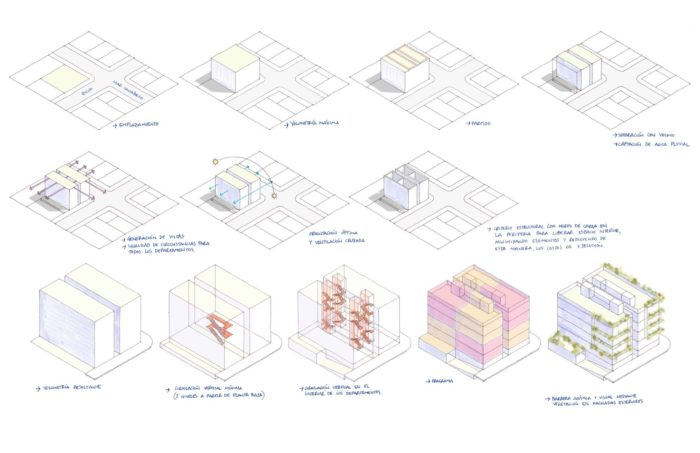
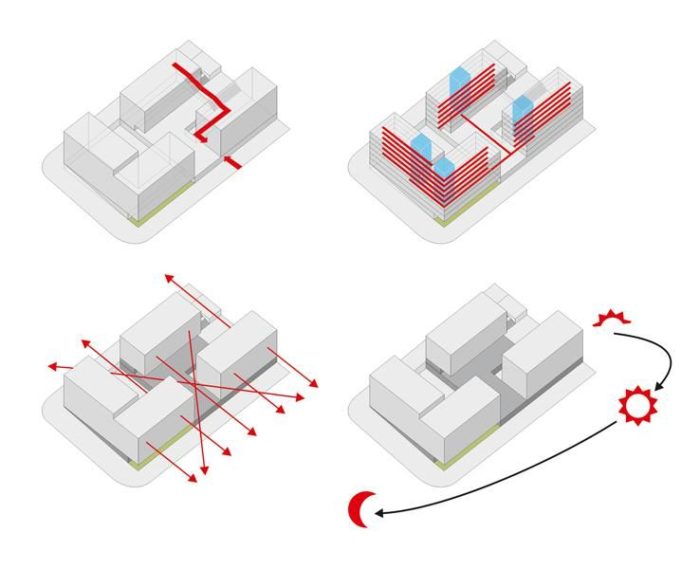
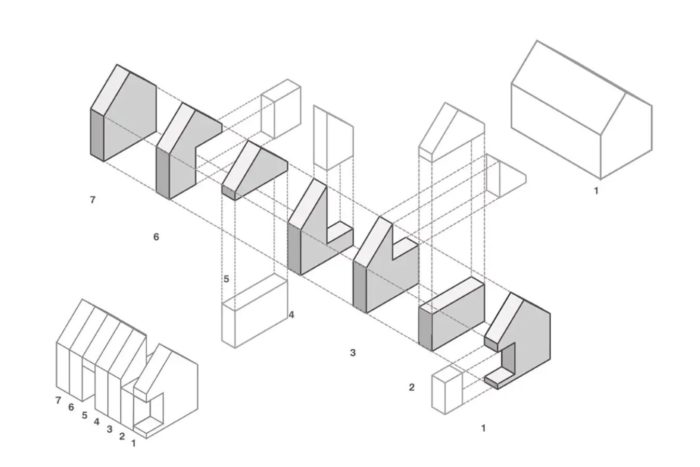
Sequential architectural diagrams function slightly differently than the others. Instead of simply one or two diagrams to convey an idea, up to eight or ten diagrams can be used. These diagrams best depict a derivative design process in which a consistent element is used throughout. In each phase, only one or two factors are at work. As a result, these diagrams must be in the correct order and preferably numbered.
10- Generative architecture:
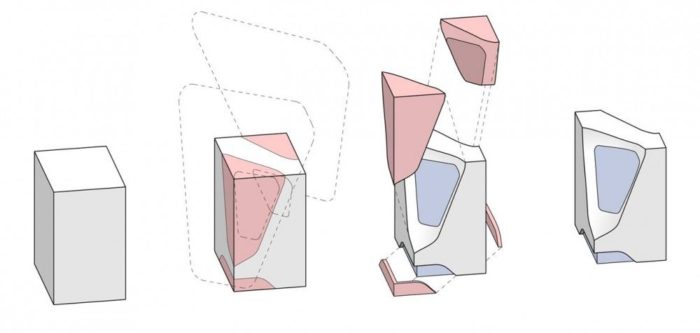
Generative diagrams are a work in progress. They, like the drawings created during the concept design stage of a construction project, are developed and revised to assist the architect in settling on an idea.
11- Topological Architectural Structure:
This type of diagram depicts the interactions between building or space elements and can explain how each space works together and fits into the larger concept.
12- Euclidian Architecture:
An Euclidian diagram resembles a grid. It depicts buildings or building elements arranged so that none may be moved without affecting the adjacent elements.
13- Schematic of a Visual Field:
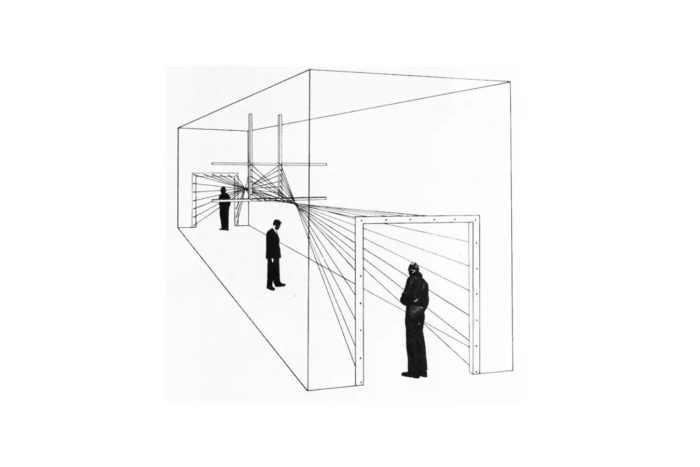
Visual field diagrams employ lines and arrows inside a ‘cone’ to show how users see a building or environment.
Diagram of Sensation Architecture
Sensation diagrams, the most abstract of all the forms, try to depict relatively ethereal aspects within a building or area, such as light, texture, and mood. The goal is to demonstrate how the human senses interact and feel.
14- Diagrammatic Buildings:
These designs, created with simple shapes, represent the building as it should look when completed but without specifications.
15- Parti:
Parti diagrams, another often used diagram in architectural design processes, convey the entire design concept. During the early conceptual design phase, architects create parti diagrams, or sketches, that relate the concept loosely to the spaces. A parti diagram contains built forms, programs, and circulations. It is critical to have strong visual communication with suitable line weights and styles, shading, sequencing, and scale to demonstrate the entire notion.
16- After The Fact Architectural Diagram:
Post-facto diagrams depict landscapes, buildings, or building elements after they have been built. The 3D fire escape route map exhibited in hotel rooms is a frequent example.
Also read: How Well Do Passive Design Strategies Reduce Carbon Footprint?
Architectural Diagrams In Digital Age
Diagrams are the storytellers of the architectural world. They weave stories of invention, challenge, and ambition, assisting in transforming ethereal concepts into the concrete and steel of our physical environment. As the discipline of architecture evolves in the digital age, with new tools and platforms at its disposal, the age-old art of diagramming plays an important role in architectural narrative. Architects use diagrams to represent their architectural concepts and to create tales that engage, inform, and inspire.
Software ecosystems are complicated and dynamic. New features are routinely developed to meet customers’ expanding needs and requests. Your team must understand your organization’s software architecture for it to scale smoothly. Here are the software architecture diagrams. They provide a visual picture for the entire development team, making communicating ideas and essential concepts easier in ways that everyone can comprehend.
Also read: 7 best professional interior design software of 2022
The Advantages of Using Software Architecture Diagrams
Aside from the fact that pictures assist people to retain and recall knowledge for more extended periods of time, software system architecture diagrams have the following advantages:
- Increase understanding: The diagrams provide an overview of the system so everyone understands how the various components interact when calculating the impact of changes and new features on the system.
- Enhance communication: Software architecture diagrams help everyone understand the game plan by matching project goals across all teams, departments, and stakeholders. They also bring stakeholders up to date on the project’s overall status.
- Encourage cooperation and identify areas for improvement: Visualizing the application system structure allows your team members to discuss the design, uncover patterns that work well, look for weak points, and recommend opportunities for improvement in a collaborative effort.
Aim of Diagrams:
Architects:
- Professional Communication: Architects work with various stakeholders, including clients, consultants, contractors, and government agencies. Diagrams enable professionals to convey complicated design concepts concisely.
Architects must update their plans as a project advances, considering feedback, site constraints, and other considerations. Diagrams can aid in the visualization and evaluation of many design iterations. - Documentation: In the business sector, documentation is essential. Diagrams explain details or procedures during the schematic design, design development, and construction documentation phases.
- Public Engagement: Architects can use diagrams to explain their ideas in community meetings for public projects or those seeking community input, enabling transparency and facilitating community involvement.
Students:
- Learning Tool: Creating diagrams can be a helpful learning tool for pupils. It enables them to translate complex architectural theories or principles into easily understood pictures.
- Portfolio Development: A well-designed diagram can considerably increase a student’s portfolio, demonstrating their design talent and ability to think critically and visually communicate ideas.
- Academic Projects: Students must frequently explain their design process, concept evolution, and final design to professors and peers. Diagrams can improve the impact and coherence of these presentations.
- Skill Development: Diagramming helps students improve their graphic representation, spatial understanding, and design synthesis skills.
- Understanding Existing Works: Students frequently investigate existing buildings or urban environments as part of their coursework. Diagramming things can provide more information about their purpose, form, and spatial relationships.
Also read: Want to Study Architecture? Online Learning Could Be Your Answer!
Drawing an Architectural Diagram:
- Use shapes and lines consistently: No hard and fast rules for the shapes and lines should be used in architectural diagrams, but consistency is crucial. Explain the significance of each element in your diagram, from a simple box to a dotted edge.
- Use a key: Anyone looking at your diagram should be able to grasp it at a glance. This entails including a key within the diagram – not on the back, not added, but right alongside the main design.
- Limit the number of colors: Architects are designers, so this should go without saying! Use the fewest number of different colors possible, and do so consistently. A muted palette is preferable unless you want to draw attention to anything, such as a safety poster.
- Feel free to make several diagrams: The more complicated your diagram becomes, the more difficult it is to grasp. It’s fine to break individual elements into different diagrams if it makes them simpler to understand, but keep the shape, color, and line similar throughout all of them.
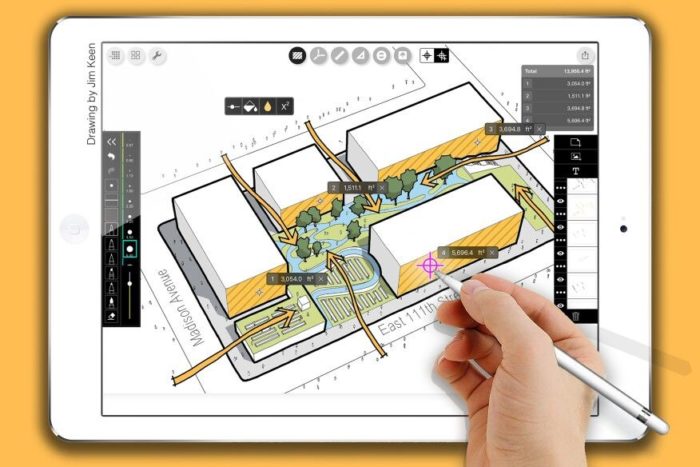
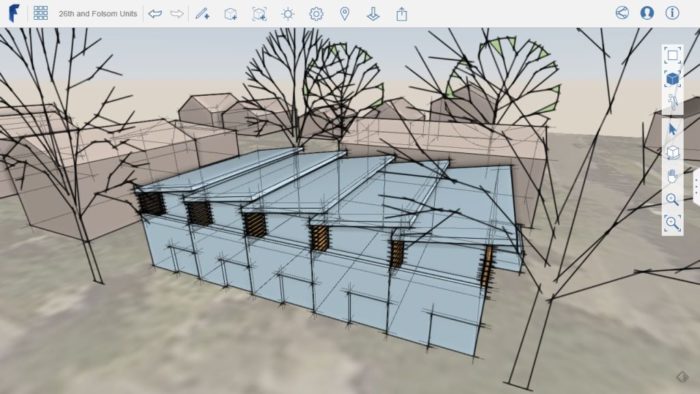
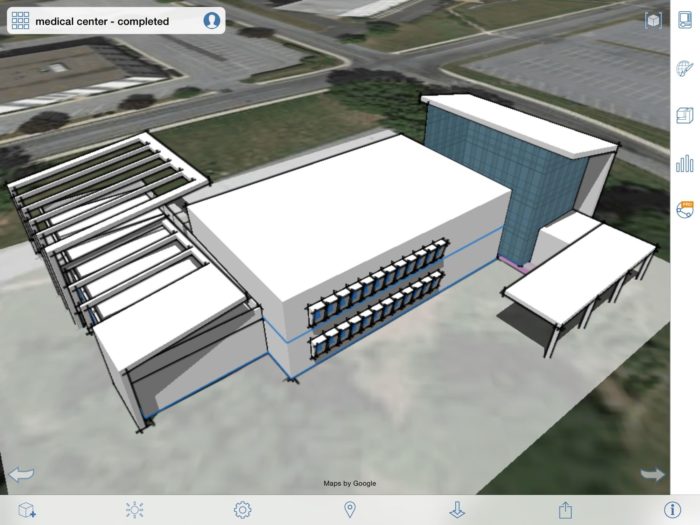
- Consider using specialized software to help you: A variety of software tools are available to assist you in creating architectural (and other) diagrams.
Also read: 6 Steps of Architectural Design Every Architect Should Know
To summarize..
In their numerous and varied shapes, architectural diagrams appear to defy classification at times – but they are a vital tool in the design process.
Diagrams are an excellent way to communicate ideas to customers and the general public; they condense enormous quantities of diverse information into small fields, and their informality and flexibility allow us to continue with a project even when not all the information is accessible.
Follow the golden guidelines of not too much, not too little, consistency, and a key that adequately describes all the features. It would help if you discovered that your architectural diagrams save you time and effort and eventually smooth your trip through a project.
[ad_2]
Source link

